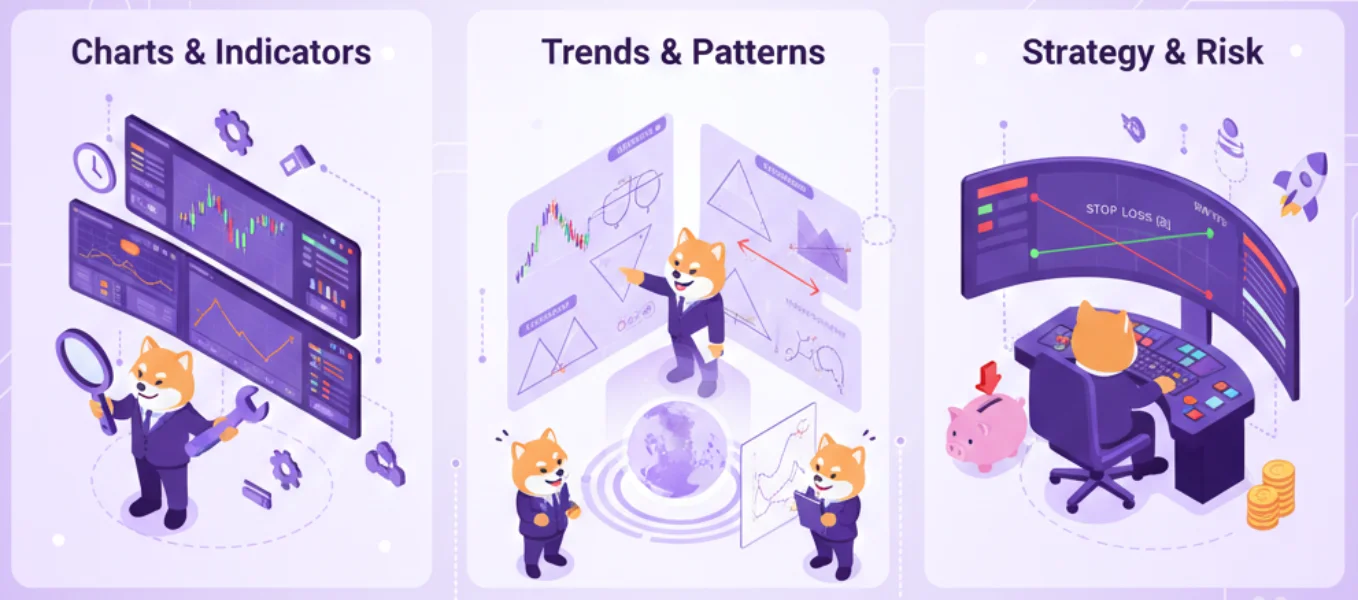
Market Analysis and Tools
What Is Technical Analysis?
In financial markets, there are two main approaches to analysis and decision-making: fundamental analysis and technical analysis.
Fundamental analysis attempts to determine the intrinsic value of an asset by examining economic, financial, and news factors; whereas technical analysis focuses solely on price behavior and trading volume and assumes that all necessary information is reflected in the price.
This article fully explains the definition of technical analysis, its principles, the tools used, and its advantages and disadvantages.
Definition of Technical Analysis
Technical Analysis is a method for forecasting future market trends by examining historical data, especially price and trading volume.
Unlike fundamental analysis, which considers news, financial reports, and economic factors, technical analysis concentrates on price charts and attempts to identify patterns and trends that have formed in past price movements in order to anticipate future market behavior.
This approach is based on the belief that price fluctuations are the result of supply and demand, and these changes can be observed in chart form.
The Three Principles of Dow Theory
Modern technical analysis is based on three principles known as Dow Theory:
1) Everything Is Reflected in the Price
Price is the core element of technical analysis, and it is believed that all information, whether economic or psychological, is reflected in the price.
2) Price Moves in Trends
Price movements are not random but follow short-term, medium-term, and long-term trends.
3) History Repeats Itself
Past trends and patterns tend to repeat in the future; therefore, analysts use chart patterns formed in the past to predict future market movements.
The Importance of Technical Analysis in the Cryptocurrency Market
The cryptocurrency market is one of the most volatile markets, and political or economic factors can quickly shift prices.
For this reason, many traders use technical analysis to determine the appropriate timing for buying and selling.
Technical patterns and tools in the crypto market often have a self-fulfilling effect because many traders pay attention to them, which increases the likelihood of predictions coming true.
Additionally, fundamental data in this market is more limited, and technical analysis helps identify short-term trends more effectively.
Technical Analysis Tools
Technical analysis includes various tools that help traders understand market conditions. These tools are divided into several main categories:
1. Types of Charts
Line Chart
This chart displays the closing price of each time period as a continuous line. It is simple to use but does not show high and low price information.
Bar Chart
Provides more information than a line chart and shows the opening, high, low, and closing prices in each bar.
Candlestick Chart
The most popular type of chart, which displays opening and closing prices as well as the price range in each period using shadows. The color of candles indicates bullish or bearish movement.
2. Trend Lines and Support / Resistance Levels
A Trend Line is a line that connects consecutive highs or lows on a chart and indicates the direction of market movement.
Support levels are areas where demand increases and price is expected not to fall further.
Resistance levels are points where supply increases and price reversal is likely.
Traders use these levels to determine entry and exit points.
3. Price Patterns
Recurring price patterns include reversal patterns (such as head and shoulders, double top, double bottom) and continuation patterns (such as triangles, flags, and wedges).
These patterns indicate whether the current trend is likely to continue or reverse.
4. Indicators and Oscillators
Indicators are mathematical tools that apply formulas to price and volume data to analyze market fluctuations.
Some of the most common indicators include:
Moving Average
The average price over a specific time period, used to smooth fluctuations. Crossovers between short-term and long-term averages can generate buy or sell signals.
Relative Strength Index (RSI)
Ranges between 0 and 100 and indicates whether the market is overbought or oversold; values above 70 typically indicate overbought conditions and below 30 oversold conditions.
MACD
The difference between two exponential moving averages and a signal line, used to identify momentum and trend direction.
Bollinger Bands
Constructed by calculating standard deviation around a moving average and used to display price volatility; price breaking outside the bands may signal the start of a strong movement.
5. Trading Volume
Trading volume represents the number or value of shares/coins traded during a period.
An increase in volume along with a price increase may confirm a bullish trend, while declining volume during a price drop may indicate weakness in a bearish trend.
Difference Between Technical and Fundamental Analysis
Fundamental analysis examines internal and external factors such as company earnings, economic conditions, news, innovation, and regulations to determine an asset’s intrinsic value.
Technical analysis focuses solely on market data (price and volume) and assumes that the effects of all fundamental factors are visible in the price chart.
These two approaches complement each other. A trader can estimate the true value of a cryptocurrency using fundamental analysis and then use technical analysis to determine the optimal entry or exit point.
Advantages and Disadvantages of Technical Analysis
Advantages
Flexibility and Speed
Because it relies on price data, technical analysis can be applied to any asset and any timeframe and can be performed quickly.
Improved Trade Timing
Using patterns and indicators, traders can select more precise entry and exit points.
Widespread Use and Self-Fulfilling Nature
Since many traders use this method, chart patterns sometimes tend to materialize.
Disadvantages
Ignoring Intrinsic Value
By examining charts alone, the true value of an asset cannot be determined; the price may be overvalued or undervalued.
Sensitivity to News
Unexpected events such as new regulations or major hacks can invalidate patterns and disrupt predictions.
Possibility of Different Interpretations
Technical tools require experience, and different analysts may reach different conclusions from the same chart.
Practical Strategies for Learning Technical Analysis
Basic and Advanced Education
First learn fundamental concepts such as charts, trends, and indicators, then move on to more complex patterns and combining multiple tools.
Practice with Historical Data
Use analytical platforms such as TradingView to practice on historical charts and recognize patterns.
Risk Management
Even the strongest analyses are not 100% accurate; therefore, always use stop loss and take profit and manage your capital.
Combine with Fundamental Analysis
For medium- or long-term trades, review the fundamental information of the project or company before entering a position.
Stay Updated
Markets change; reviewing important news, economic events, and cryptocurrency project updates alongside technical analysis can give you a more comprehensive perspective.
What Is<span class="classic-app-under " TradingView?
(TradingView)
In the fast-paced world of financial markets, seconds determine the fate of your capital. If you are looking for a platform that provides speed, accuracy, and professional tools simultaneously, there is no better option than TradingView. In this article, we examine this platform from A to Z.
1. TradingView; More Than Just a Charting Website
TradingView is a web-based technical analysis platform. Unlike older software such as MetaTrader, which had a rigid and complex interface, TradingView leverages HTML5 technology to provide a smooth, fast, and enjoyable experience directly in your browser.
This website is not just for viewing prices; it is also a social network for traders where ideas, strategies, and programming codes are shared.
2. Unique Features You Should Know
A) Pine Script Programming Language
One of the main reasons for TradingView’s superiority is its proprietary language, Pine Script. This language allows users to:
Create customized indicators.
Convert their trading strategies into code.
Run backtests (test their strategies on historical market data to evaluate profitability).
B) Multi-Chart Capability
In paid versions, you can view up to 8 different charts on one screen. For example, you can simultaneously monitor Bitcoin, Ethereum, the Dollar Index, and Gold charts to understand market correlations.
C) Professional Screening (Screener)
With the Stock/Crypto Screener tool, you no longer need to check assets one by one. You can set conditions such as:
“Show me only the assets whose RSI is below 30 and have formed a Golden Cross on the 4-hour timeframe.”
3. Overview of TradingView Menu Sections
1. Left Panel (Drawing Tools)
Includes drawing tools such as trend lines, channels, Fibonacci, classic patterns, and profit/loss measurement tools (Long/Short Position).
2. Right Panel (Watchlist & Alerts)
Manage selected asset lists and set price alerts.
3. Top Bar
Change timeframes, select chart types (candlestick, line, etc.), and add indicators.
4. Bottom Panel
Includes Paper Trading (virtual trading), strategy tester, and the Pine Script code editor.
4. Detailed Comparison of TradingView Accounts (Updated 2026)
Basic Account (Free)
Number of indicators: 2 per chart
Charts per tab: 1 chart
Price alerts: 1
Advertisements: Yes
Second-based timeframes: No
Essential Account
Number of indicators: 5 per chart
Charts per tab: 2 charts
Price alerts: 40
Advertisements: No (fully removed)
Second-based timeframes: No
Plus Account
Number of indicators: 10 per chart
Charts per tab: 4 charts
Price alerts: 100
Advertisements: No
Second-based timeframes: No
Premium Account
Number of indicators: 25 per chart
Charts per tab: 8 charts
Price alerts: 400
Advertisements: No
Second-based timeframes: Yes (1, 5, 15, and 30 seconds)
5. Guide to Using Paper Trading (Risk-Free Trading)
One of the best sections for beginners is Paper Trading. You can trade in a real market environment using virtual money. This helps you practice your strategies and eliminate trading fear without losing even a single dollar.
6. Security and Privacy Tips
Since TradingView connects to various exchanges (via API), its security level is very high. However, it is always recommended to:
7. Conclusion
Today, TradingView has become the “Google” of the trading world. Whether you are a Day Trader or a long-term investor (Holder), this platform offers tools that significantly increase your analytical accuracy.
Strengths:
Million-strong community and learning from professionals
Highly accurate and fast data
Professional mobile application
Weaknesses:
High subscription cost for users with small capital
Requires a stable and relatively fast internet connection
Support and Resistance in Technical Analysis
Support and resistance levels are among the most important and fundamental concepts in technical analysis. They help traders identify potential points where price may stop, reverse, or continue moving. These levels are applicable in any financial market, including cryptocurrencies, forex, stocks, and commodities, and are a key tool in making entry and exit decisions.
Support (Support)
A support level is a price level where buying interest (demand) increases enough to prevent the price from falling further.
In other words, when the price reaches a support area, it usually pauses and tends to rise because buyers enter the market and stop the price decline.
Support acts like a floor: If the price reaches this area, there is a higher probability of a rebound upwards.
This level becomes more valid when the price has reacted (touched) it multiple times and bounced back.
Resistance (Resistance)
A resistance level is a point on the chart where selling pressure increases and prevents the price from rising further.
Whenever the price approaches this line, sellers become more active, and the price often decreases until supply overcomes demand.
Behavior and Role of These Levels
If the price breaks below a support level, that level often turns into resistance.
Conversely, if the price breaks through a resistance level and stabilizes above it, the former resistance can turn into support.
This is a fundamental principle in technical analysis and reflects supply and demand dynamics. Breaking levels usually indicates a shift in market equilibrium
How to Draw Support and Resistance Levels
These levels are usually drawn by connecting price lows for support and price highs for resistance on the chart.
The following tools can also help identify these levels:
Trendline: In an uptrend, connecting the lows acts as support, while in a downtrend, connecting the highs acts as resistance.
Indicators: Tools like Moving Averages and Fibonacci Retracements can create dynamic support and resistance levels.
Pivot Points: Calculated support and resistance levels based on previous prices, often used in daily analysis, such as S1, S2 and R1, R2.
Importance of Support and Resistance in Trading
Support and resistance provide traders with key insights:
Identifying entry and exit points with better probability
Logically determining stop-loss and take-profit levels
Helping to detect trend continuation or reversal
Combining with other technical tools such as indicators and patterns for better decision-making
Regardless of the asset type, these levels are a practical tool in technical analysis and form the basis of many trading strategies.
Trends and Patterns
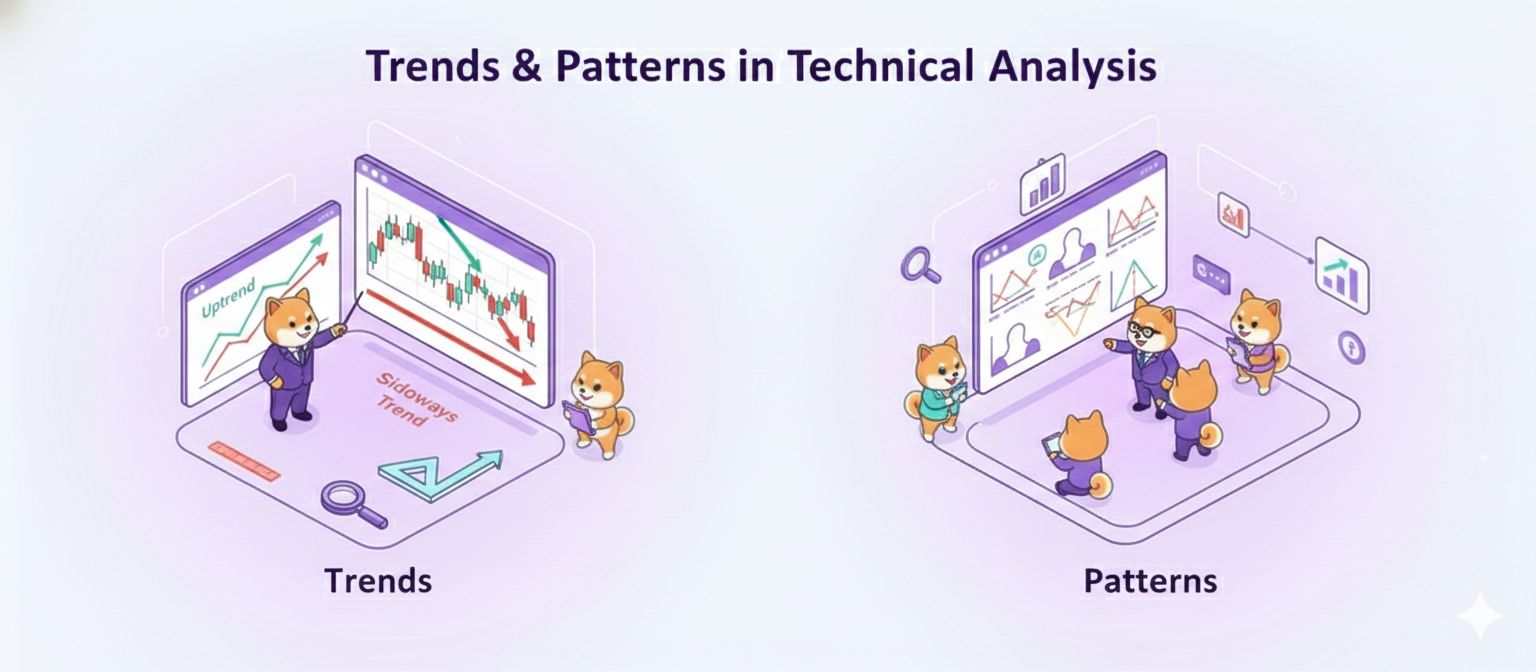
In technical analysis, trends and patterns are two very important concepts that traders use to understand market behavior, predict future price movements, and find entry and exit points. These concepts are widely applied in markets such as cryptocurrencies, forex, stocks, and commodities.
Trends in Technical Analysis
A trend refers to the general direction in which the price moves on a chart. Technical analysts believe that prices in the market tend to move in a specific direction until there is a sign of trend reversal. Trends are generally classified into three main types:
Uptrend: Prices are rising, forming higher highs and higher lows. This indicates buyer strength.
Downtrend: Prices are falling, forming lower highs and lower lows. This indicates seller strength.
Sideways / Range: Prices move horizontally without a clear direction, indicating a relative balance between supply and demand.
Trendlines are one of the main tools to draw and identify these trends. An uptrend line is drawn by connecting two consecutive ascending lows, and a downtrend line is drawn by connecting two consecutive descending highs. Trendlines can also serve as dynamic support or resistance.
Patterns (Patterns)
Chart patterns are geometric shapes or structures that appear on price charts. Based on past price behavior, they can be used to predict future price movements. These patterns reflect the interaction of supply and demand and market psychology, and they have repetitive forms that traders use to forecast trend continuation or reversal.
Chart patterns are generally divided into two main categories:
Continuation Patterns: Indicate that the current trend is likely to continue (e.g., Flag).
Reversal Patterns: Indicate that the previous trend may reverse (e.g., Head and Shoulders, Double Top).
Common Chart Patterns
Some of the most well-known patterns in technical analysis include:
Double Top and Double Bottom: Classic reversal patterns indicating trend weakness.
Head and Shoulders: A strong reversal pattern.
Cup and Handle: Typically signals the continuation of an uptrend and marks the end of a corrective move.
Wedge Patterns: Such as Rising Wedge and Falling Wedge, which may indicate acceleration or deceleration of the trend.
Candlestick Patterns: Examples include Hammer, Doji, and Engulfing, which help determine trend direction and potential reversal points.
These patterns are formed based on trendlines, highs and lows, and price movements. By identifying them, analysts can generate potential entry or exit signals.
Relationship Between Trends and Patterns
Trends show the overall direction of price movement, while patterns interpret the behavior of price within that trend. Many patterns, such as Head and Shoulders or Double Top, can signal a trend reversal when they appear within a trend. Continuation patterns like Flags indicate a probable continuation of the current trend.
Summary
In technical analysis:
Trends define the general direction of price movement and guide traders to trade in line with the market flow.
Patterns are repetitive price shapes that help predict trend continuation or reversal.
Combining trends and patterns gives analysts powerful tools to analyze probable future behavior based on historical data and make more informed trading decisions.
Indicators
(RSI، MACD، EMA)
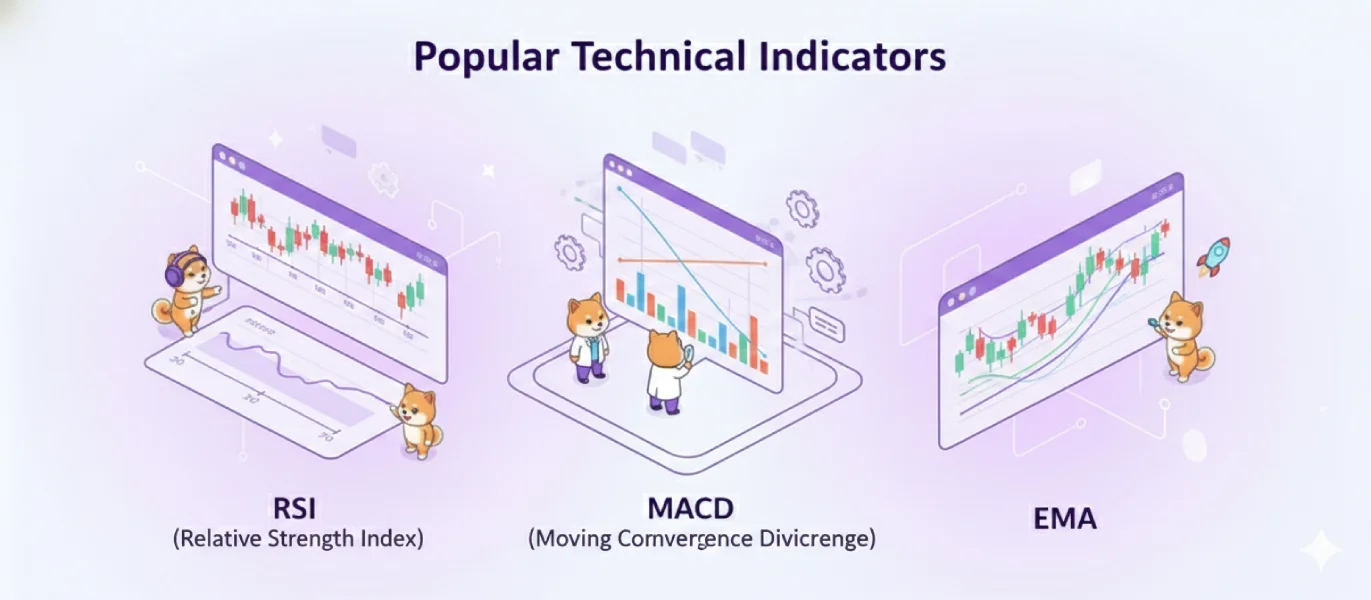
In technical analysis, indicators are mathematical tools that use price data such as price, volume, and averages to help traders better identify trends, momentum, and potential entry and exit points. They assist in making more informed trading decisions. Below are three commonly used indicators:
RSI (Relative Strength Index)
The RSI is a momentum indicator that measures the speed and change of price movements, showing whether an asset is in an overbought or oversold condition. RSI values range from 0 to 100:
RSI helps traders identify the strength or weakness of a trend and potential reversal points. Additionally, divergences between price and RSI can be used to anticipate possible market direction changes.
MACD (Moving Average Convergence Divergence)
MACD is an indicator used to detect trend, momentum, and price direction changes. It measures the difference between two Exponential Moving Averages (EMA) and typically includes three components:
MACD Line: Difference between EMA 12 and EMA 26
Signal Line: EMA 9 of the MACD line
Histogram: Shows the distance between the MACD line and the Signal line
When the MACD line crosses the Signal line (crossover), it can generate buy or sell signals:
MACD helps assess trend strength and momentum shifts, improving the identification of trading opportunities.
EMA (Exponential Moving Average)
EMA is a type of moving average that gives more weight to recent prices, making it more sensitive to recent price changes compared to a Simple Moving Average (SMA).
EMA is particularly useful for detecting short-term trend changes.
Because it emphasizes recent data, it can indicate trend reversals earlier and help traders set more precise entry and exit points.
Combined Use of These Indicators
Using these indicators together can provide a more complete picture of market conditions. For example:
RSI in the oversold zone,
MACD crossover signaling a buy, and
Price stabilizing above the EMA
…could together indicate a strong buy signal.
Additionally, combining multiple indicators with support and resistance levels can produce more reliable signals and reduce the risk of relying on a single tool.
Summary
RSI: Measures overbought/oversold conditions and trend strength.
MACD: Analyzes trend direction and momentum changes.
EMA: Sensitive moving average that highlights recent trend changes faster.
Using these indicators together with other technical tools helps traders make more informed decisions and better risk management in trading.
Time Frames
and Their Uses
In technical analysis, a time frame refers to the period that each candle or bar represents on a price chart. For example:
1. Distinguishing Trading Perspectives
The choice of time frame determines the trader’s market perspective:
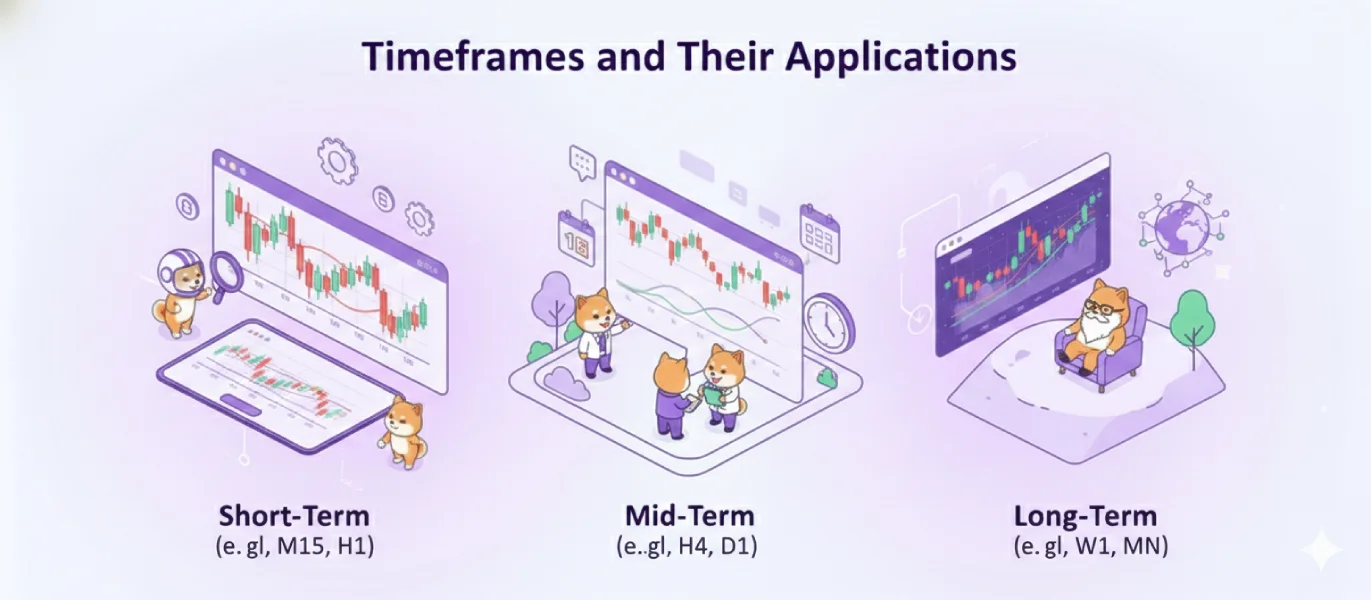
Short-term: 1, 5, or 15 minutes — suitable for scalping and quick trades. These time frames have higher price noise, and false signals are more common.
Medium-term: 1-hour or 4-hour — appropriate for day trading or swing trading, allowing better interpretation of smaller trends.
Long-term: Daily, weekly, or monthly — shows major trends, more reliable for long-term investing.
2. Time Frame and Trading Style
Time frame selection is directly related to your trading strategy:
Scalpers focus on very short time frames to capture small price movements.
Day traders typically use 5-minute to 1-hour charts.
Swing traders often use 4-hour and daily charts to identify medium-term trends.
Long-term investors concentrate on weekly and monthly charts to track the overall market direction.
3. Time Frame and Risk Management
Shorter time frames:
Longer time frames:
The main trend is clearer, reducing analysis errors.
However, entry points may be delayed because rapid price movements appear later.
4. Multi-Time Frame Analysis
Multi-time frame analysis involves examining an asset across several time frames:
Start with a longer time frame to identify the overall trend.
Use medium and shorter time frames to refine entry and exit points.
This method provides a broader and more reliable perspective on price movements.
Conclusion
Time frames determine:
Using multiple time frames simultaneously makes your analysis more accurate and reliable, as it considers both long-term trends and precise short-term entry points, reducing potential errors.
Memecoin Analysis
When analyzing memecoins, standard technical and fundamental analysis methods need to be adapted, because unlike regular cryptocurrencies, memecoins usually lack intrinsic value, technological adoption, or practical use cases. Their price behavior is heavily influenced by social narratives, online communities, and media-driven hype.
1. Nature of Memecoins
Memecoins are digital currencies inspired by internet memes, online culture, and community enthusiasm. Most of them do not have unique technology or real economic utility, and their value is based on social appeal and market excitement, rather than real-world products or services.
This nature makes memecoin analysis different:
Price movement cannot rely solely on chart data.
Social factors, online communities, and community support must be considered.
Whale activity and pump-and-dump behavior are highly relevant.
2. Analysis Methods for Memecoins
2.1 Specialized Technical Analysis
Memecoin analysis still uses technical tools, but with adjustments:
Examine trends and chart patterns.
Use indicators like RSI, MACD, EMA to gauge momentum and potential reversal points.
Be able to identify false signals, as memecoin volatility is extreme, and standard signals can easily fail.
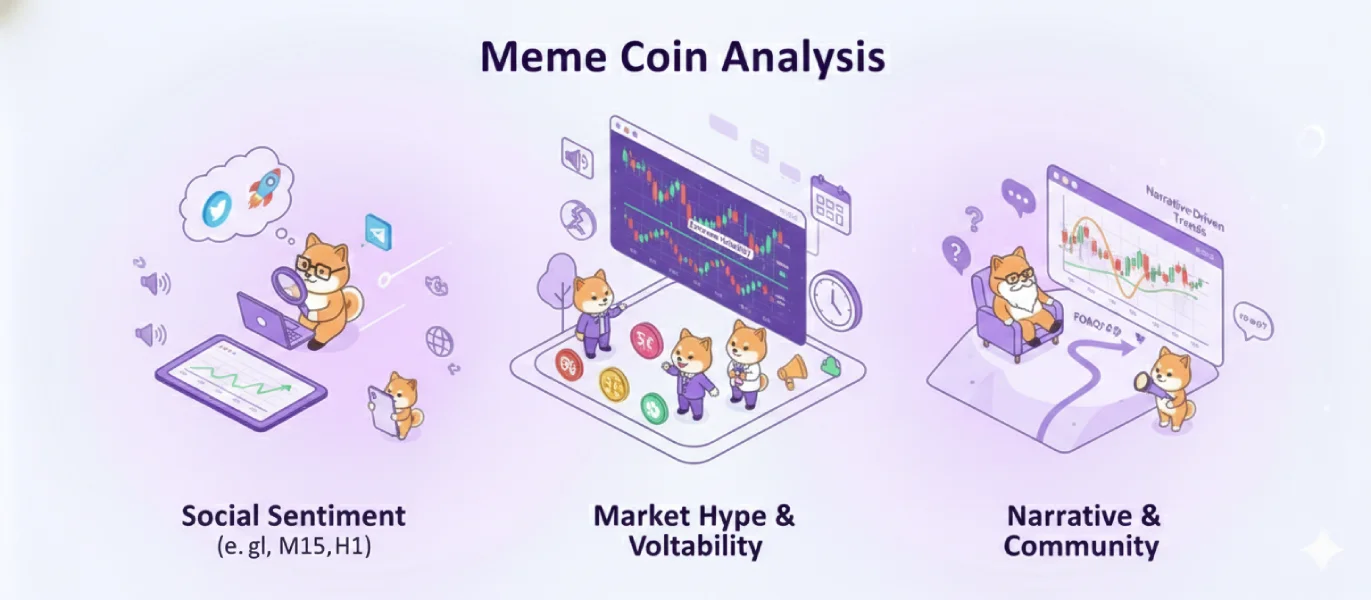
Note: Due to extreme volatility, short- and medium-term time frames often provide more reliable signals than long-term charts, though with higher risk.
2.2 Memecoin-Specific Fundamental Analysis
Unlike regular cryptocurrencies, memecoin fundamentals focus on social factors rather than technology or utility:
Community strength and member engagement
Social media interactions
News and marketing campaigns
Transparency and communication of the development team
Memecoins typically lack traditional fundamentals, so fundamental analysis involves evaluating social activity, marketing reach, and viral potential.
2.3 Market Sentiment Analysis
Sentiment analysis is crucial for memecoins because price movement is often driven by community excitement and social trends:
Data comes from chat rooms, Twitter, Reddit, Discord, and other community channels.
Sentiment tools can detect FOMO (Fear of Missing Out) or panic selling, helping traders make timely decisions.
Memecoins are essentially Pure Belief Assets, whose value derives from emotional participation rather than actual project revenue or utility.
2.4 Whale Activity and Liquidity Monitoring
Memecoins often have low liquidity and uneven token distribution:
Tracking whale activity can provide stronger signals than classic technical analysis.
In low-liquidity markets, large trades can dramatically move prices.
On-chain data and holder/transaction analytics are useful for understanding potential trends and price movements.
3. Key Considerations in Memecoin Analysis
3.1 Combine Multiple Analyses
A robust memecoin analysis typically combines:
This holistic approach gives a clearer picture of the project’s status and potential price movements.
3.2 High Risk
Memecoins are extremely volatile and often lack intrinsic value. Even the best analysis may fail, so strict risk management and immediate stop-losses are essential.
Conclusion
Memecoin analysis differs from regular crypto analysis because these assets derive value from collective behavior, social networks, and online hype, rather than fundamentals or real utility.
To analyze effectively:
Use technical analysis on appropriate time frames
Evaluate community activity and market sentiment
Monitor liquidity and whale behavior
Always account for high risk and the possibility of error
This approach helps traders navigate the unpredictable and hype-driven nature of memecoins.